Want to jump straight to the paper? It’s still in pre-print form, but I’ve already included a lot of edits suggested by the peer-reviewer! https://arxiv.org/abs/2504.07325 (you can also view the paper as a webpage! It will give an error—just ignore it.)
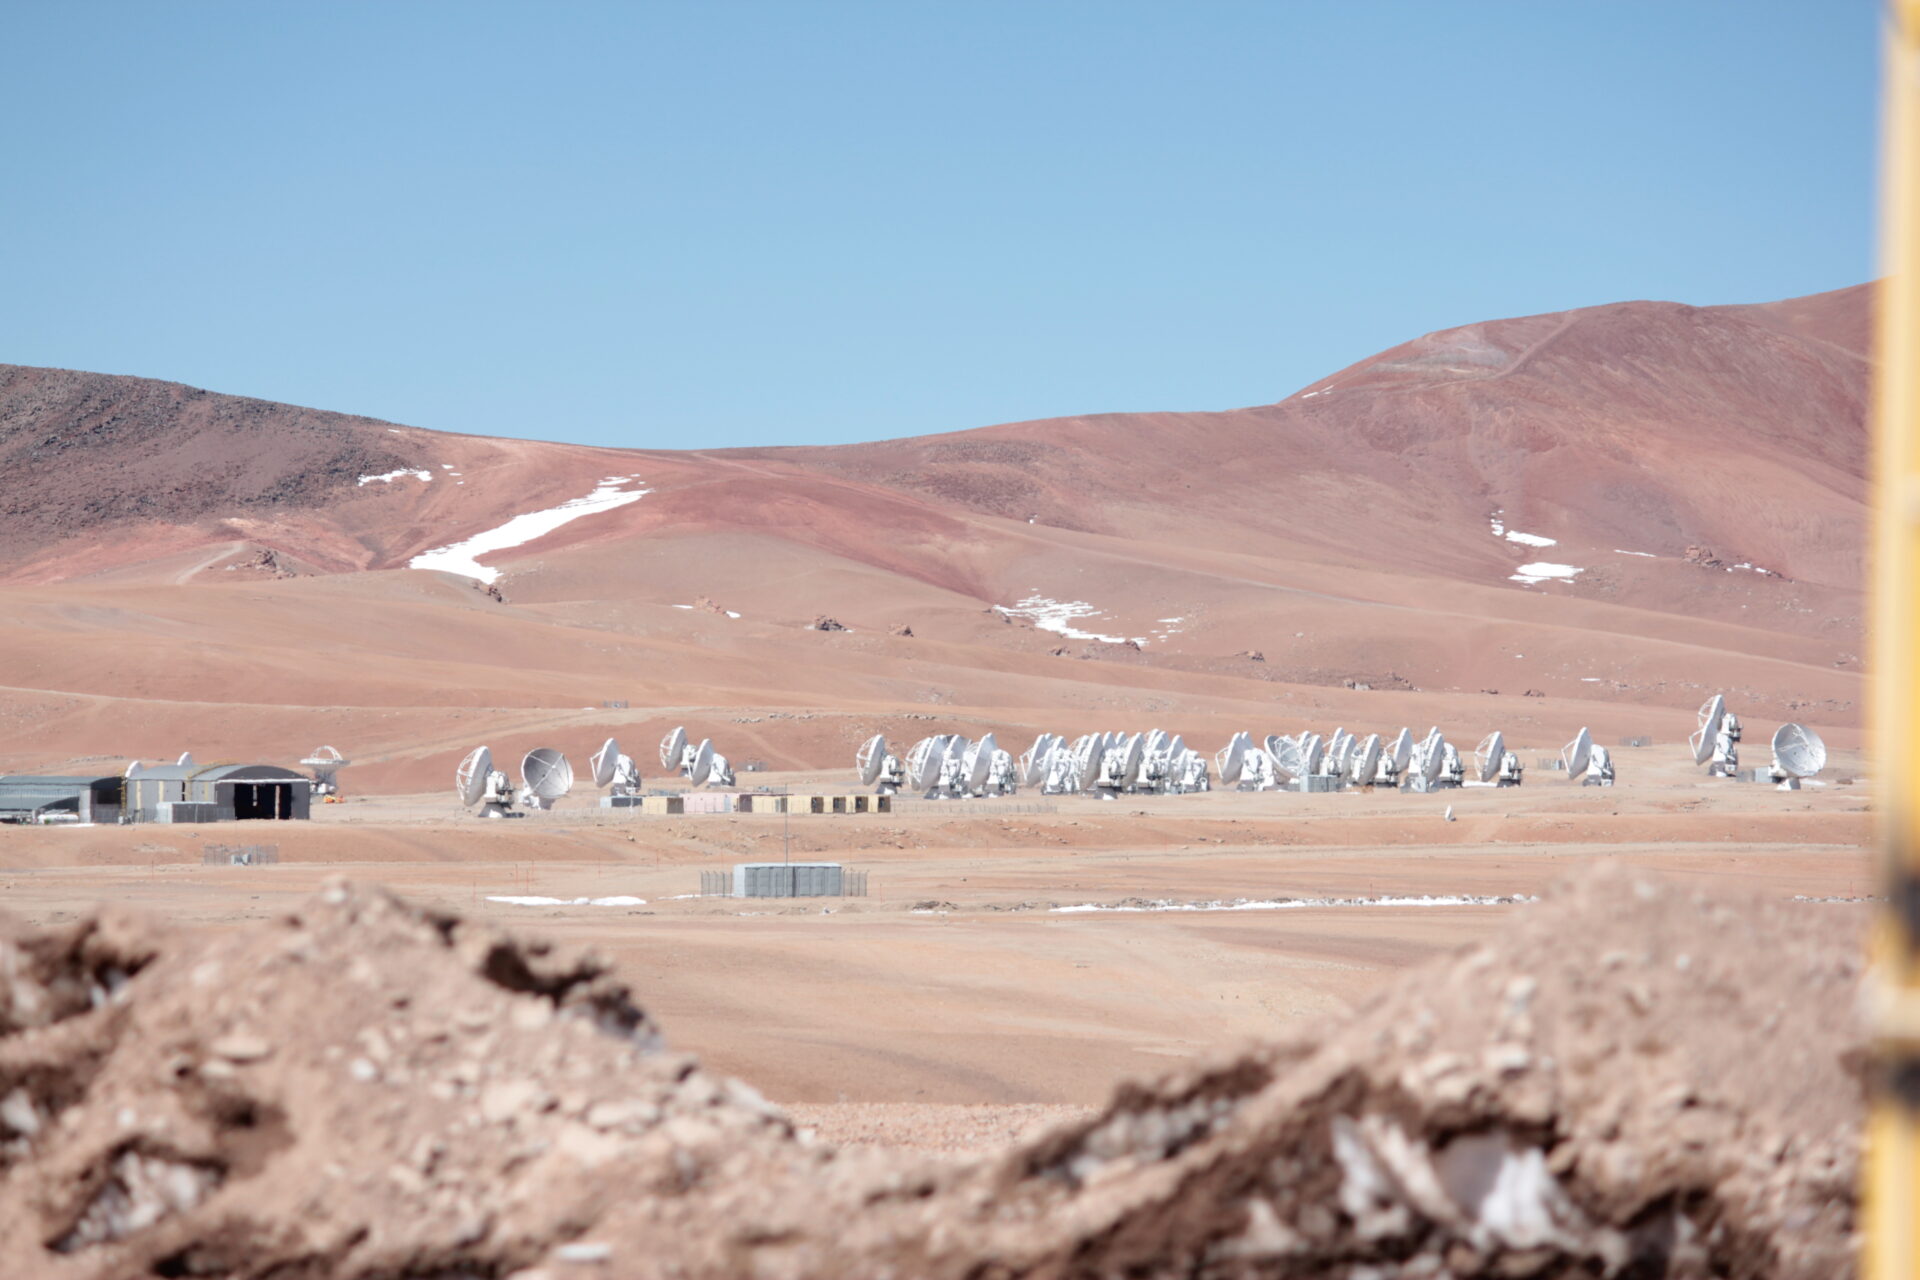
In graduate school, I was lucky enough to have access to data from one of the most advanced telescopes in existence: the Atacama Large Millimeter/submillimeter Array (ALMA), pictured here.
ALMA is best described as 66 radio dishes working together to collect light with wavelengths around a millimeter. You may have seen airport security scanners labeled as ‘millimeter wave technology’—that’s the same type of light, used in a very different way. In both cases, however, millimeter radiation is absorbed by water. The airport scanner looks for water in your body. Water in the atmosphere interferes with ALMA’s ability to see into space, so it’s located at an altitude of 16,000 ft in one of the driest places on earth.
In 2015, before I got to grad school, my (future) adviser, Gordon Stacey, and his research group were awarded time on ALMA to observe the galaxy “SDSS J1000” that was part of an earlier survey looking for carbon atoms in the galaxy’s gas. They had surveyed some of the brighter galaxies (as seen at millimeter wavelengths) with the original z (redshift) and Early Universe Spectrometer (ZEUS) instrument1 looking to use the light emitted by that carbon to determine how stars were forming in these galaxies.
More specifically, they were looking for light emitted by ionized carbon (carbon with one electron missing). Photons are emitted, generally speaking, when electrons change energy levels. If the outermost electron in the ionized carbon atom changes its total angular momentum2, the small energy difference between the two momentum states lets it emit a characteristic photon with a wavelength of 158 microns (μm), or 0.158 millimeters. We call this the [CII] line for historical reasons. (The value of the roman numeral in that notation is equal to the ionization state plus one, and the brackets indicate that the transition has this angular momentum component).
If we measure exactly how much [CII] 158 μm light is coming from a specific galaxy, and compare it to other types of light, we can work out quite a few details about what’s going on in the galaxy, even if it’s so far away that it just looks like a single point! Of course, the devil’s in the details, and we have to do more observations to get the brightnesses of other things, like dust or other types of atoms.
Long story short, Gordon and the ZEUS team’s observations supported a theory that star formation was occurring very rapidly all throughout the galaxy, and similar conditions in other galaxies in their survey. Now, while they had to treat SDSS J1000 as a single point, with ALMA we could get an image of the galaxy!
ALMA Observations
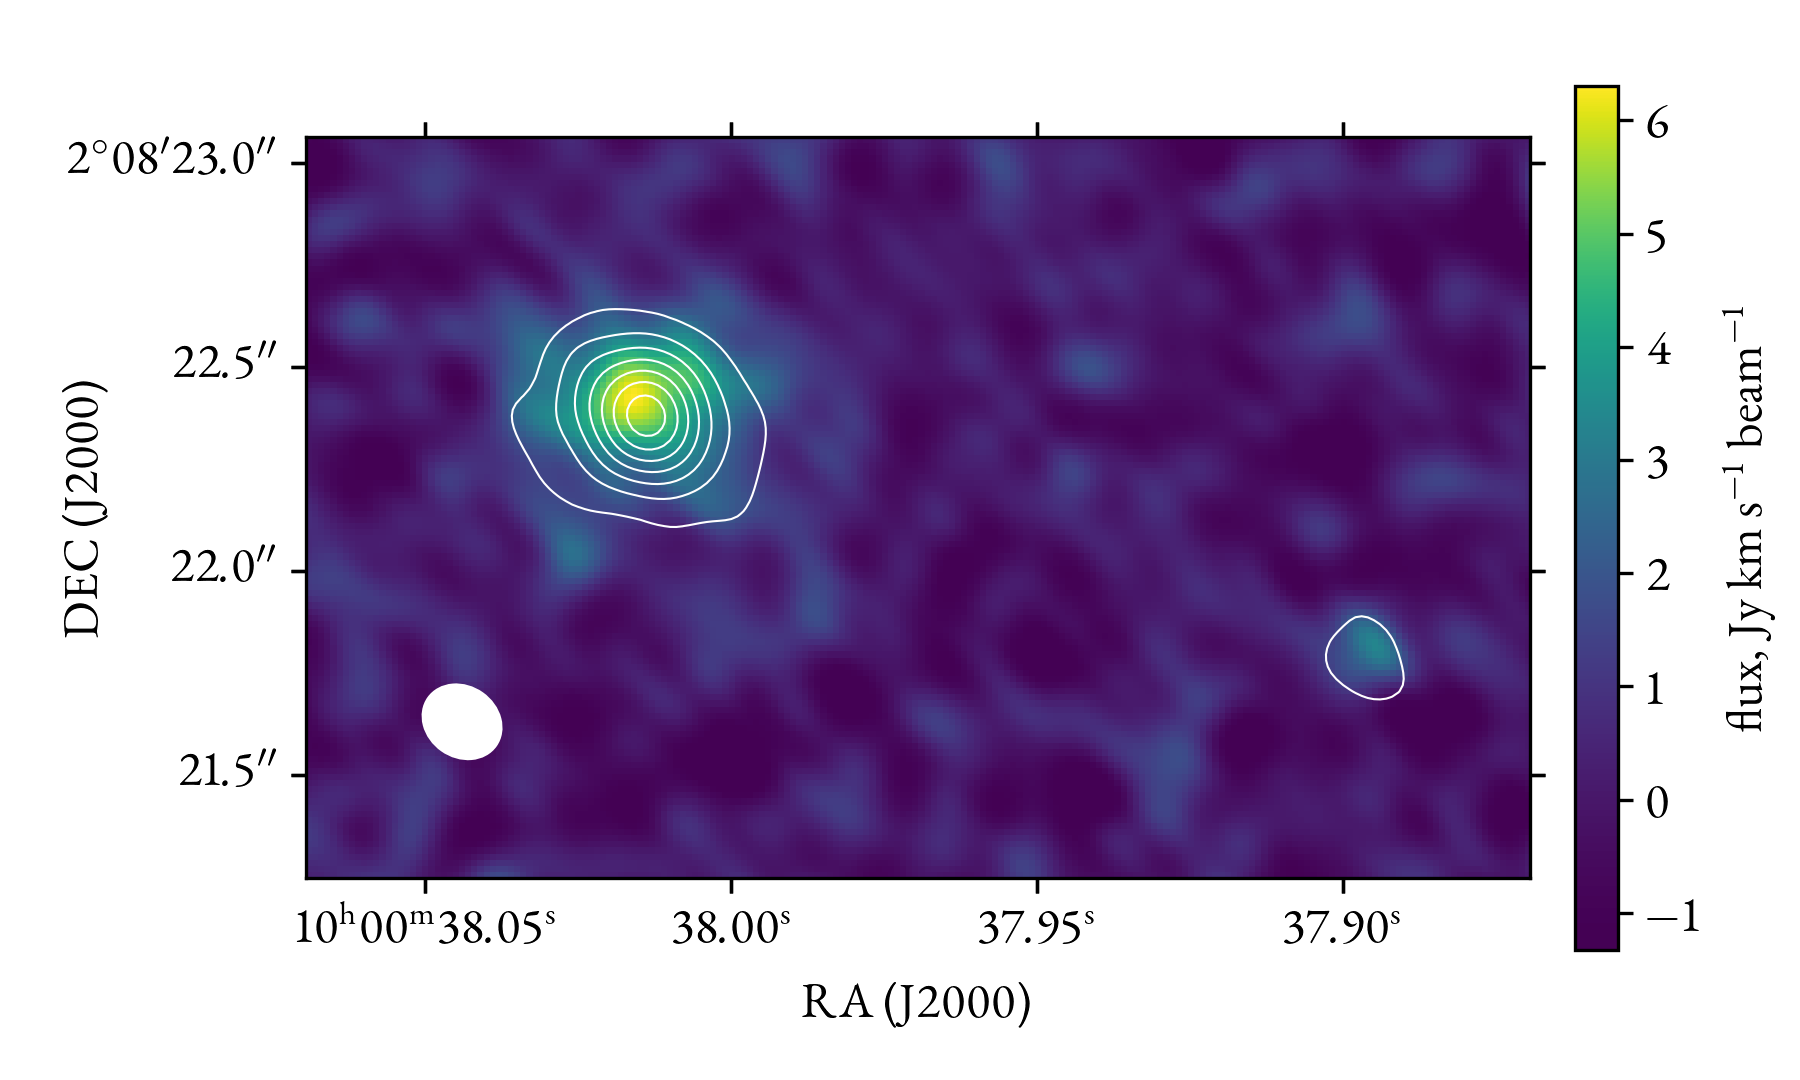
Not impressed by this blob? It doesn’t seem like much but this isn’t an easy thing to do. In that image, J1000 is the brighter, larger spot on the left (we’ll talk about the fainter one in a bit). The white oval in the lower left represents the ‘beam size’. Features smaller than the beam size will be blurred out until they appear about that big. Two points closer than that from each other aren’t independent—we only want to compare points which are farther away.
The false-color image here is the map of the [CII] itself, while the white lines overlaid on top represent the brightness of light emitted by dust. I like to say that interstellar dust is not very similar to what we’d call dust here on Earth. Interstellar dust is more like smoke: tiny particles and complex organic molecules. But the important thing about dust is that it absorbs ultraviolet and visible starlight, and radiates the same amount of energy as far-infrared light (FIR), which is what ALMA detects here.
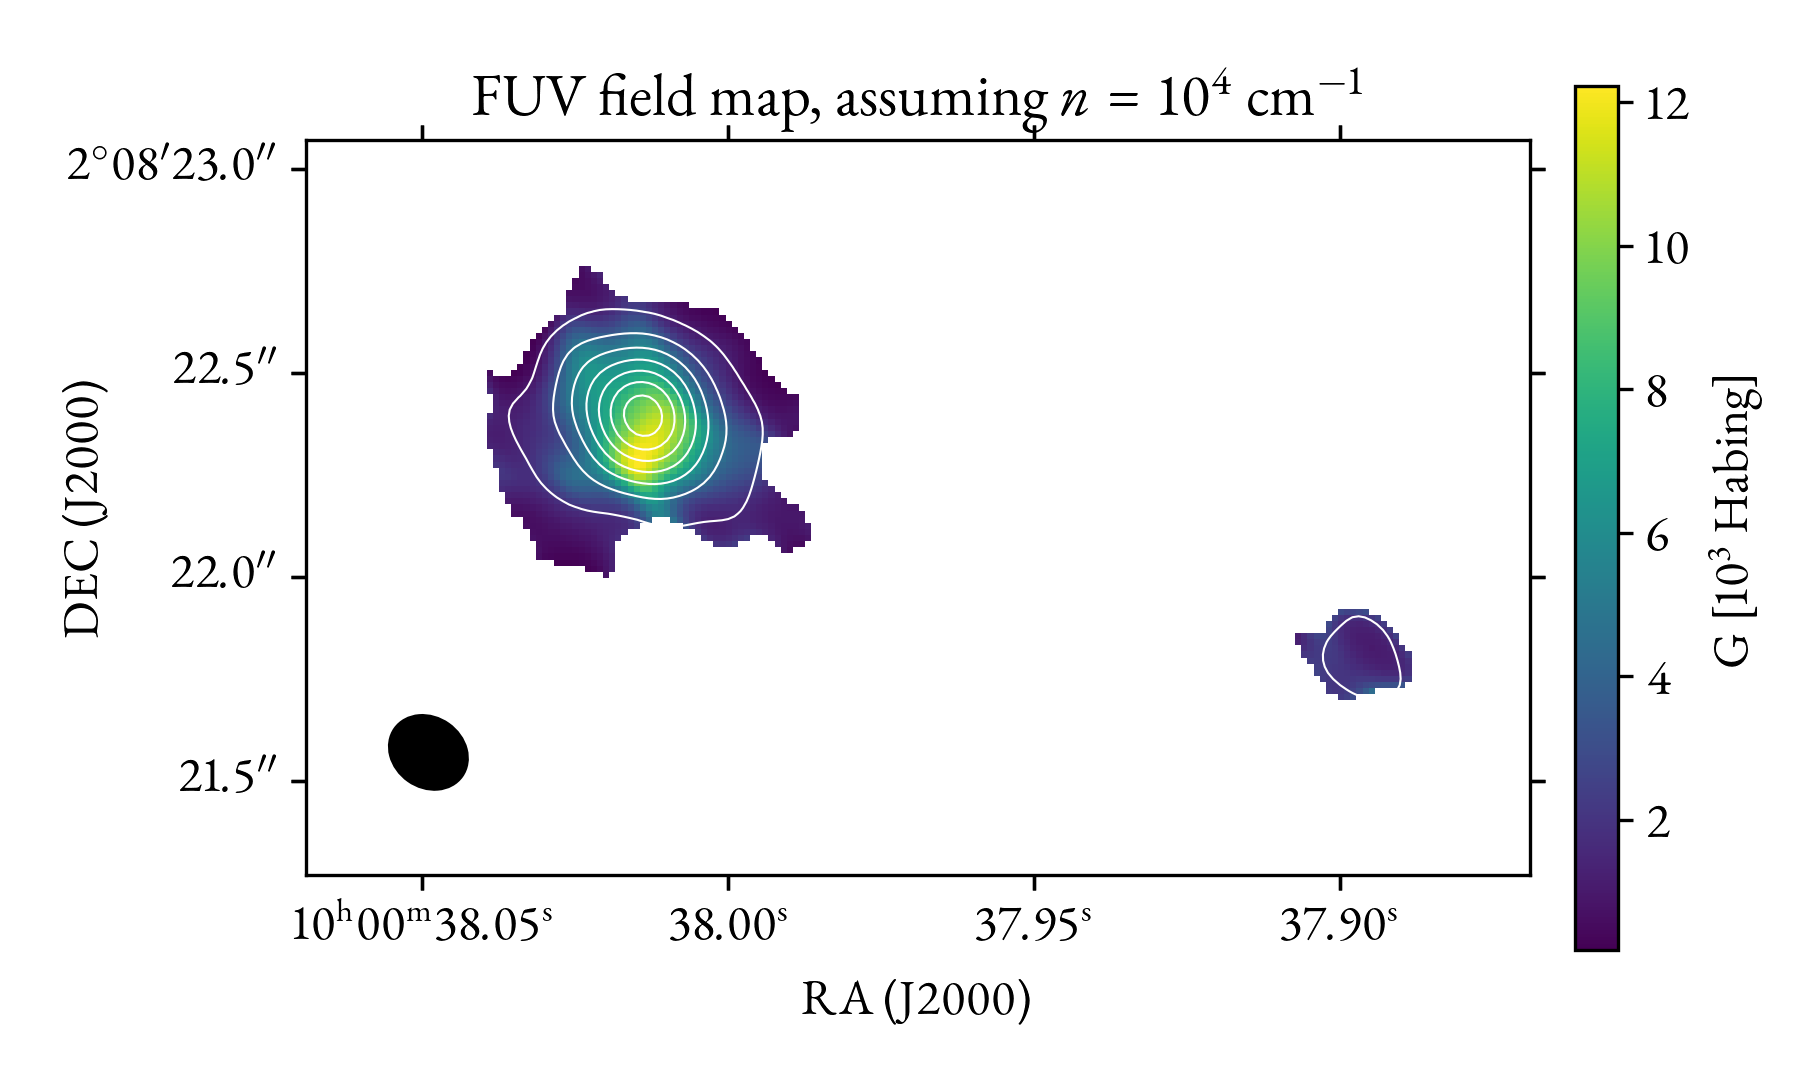
If we divide the [CII] by the FIR dust emission, we get a very accurate picture of how much UV starlight there is across the whole galaxy. The color scale here is in Habing units. One Habing corresponds to about how much UV there is near the Sun coming from other stars. Everywhere in this galaxy has more than 1,000 times as much UV as that, with the central/south region at more than 10,000 times! This is evidence that enormous amounts of stars are forming in this galaxy, since only super-hot stars called O and B type stars can produce the UV required to ionize Carbon and heat the dust, and those only last tens of millions of years.
So it’s safe to say that over the 10 or so million years before we observed it, SDSS J1000 has been producing 1,600 times the mass of the Sun in new stars every (Earth) year! For reference, the Milky Way only produces about 1 Solar mass worth of stars per year. So while the Milky Way is a rather calm place, SDSS J1000 is HOPPIN’! Of course, we’re seeing J1000 as it was when the Universe was less than 4 billion years old, and you do expect young’uns to be more energetic than older folks like the Milky Way (which is about 13 billion years old).
You may also notice a second, dimmer blob to the right of the main blob. Before these ALMA images, it was visible in Hubble images, but there was no way to know how far it was from us. Was it the same distance away as J1000, and therefore close to J1000? Or was it a completely different distance away, just in a similar direction? Well, now that we have observed the same spectral line from both areas, we can confirm that they really are neighbors!
Of course, while I was figuring all this out in grad school, other scientists were up to all sorts of other hijinks. Including one team which said “Let’s use the new James Webb Space Telescope (JWST) and map a certain area of the sky!”
JWST Observations
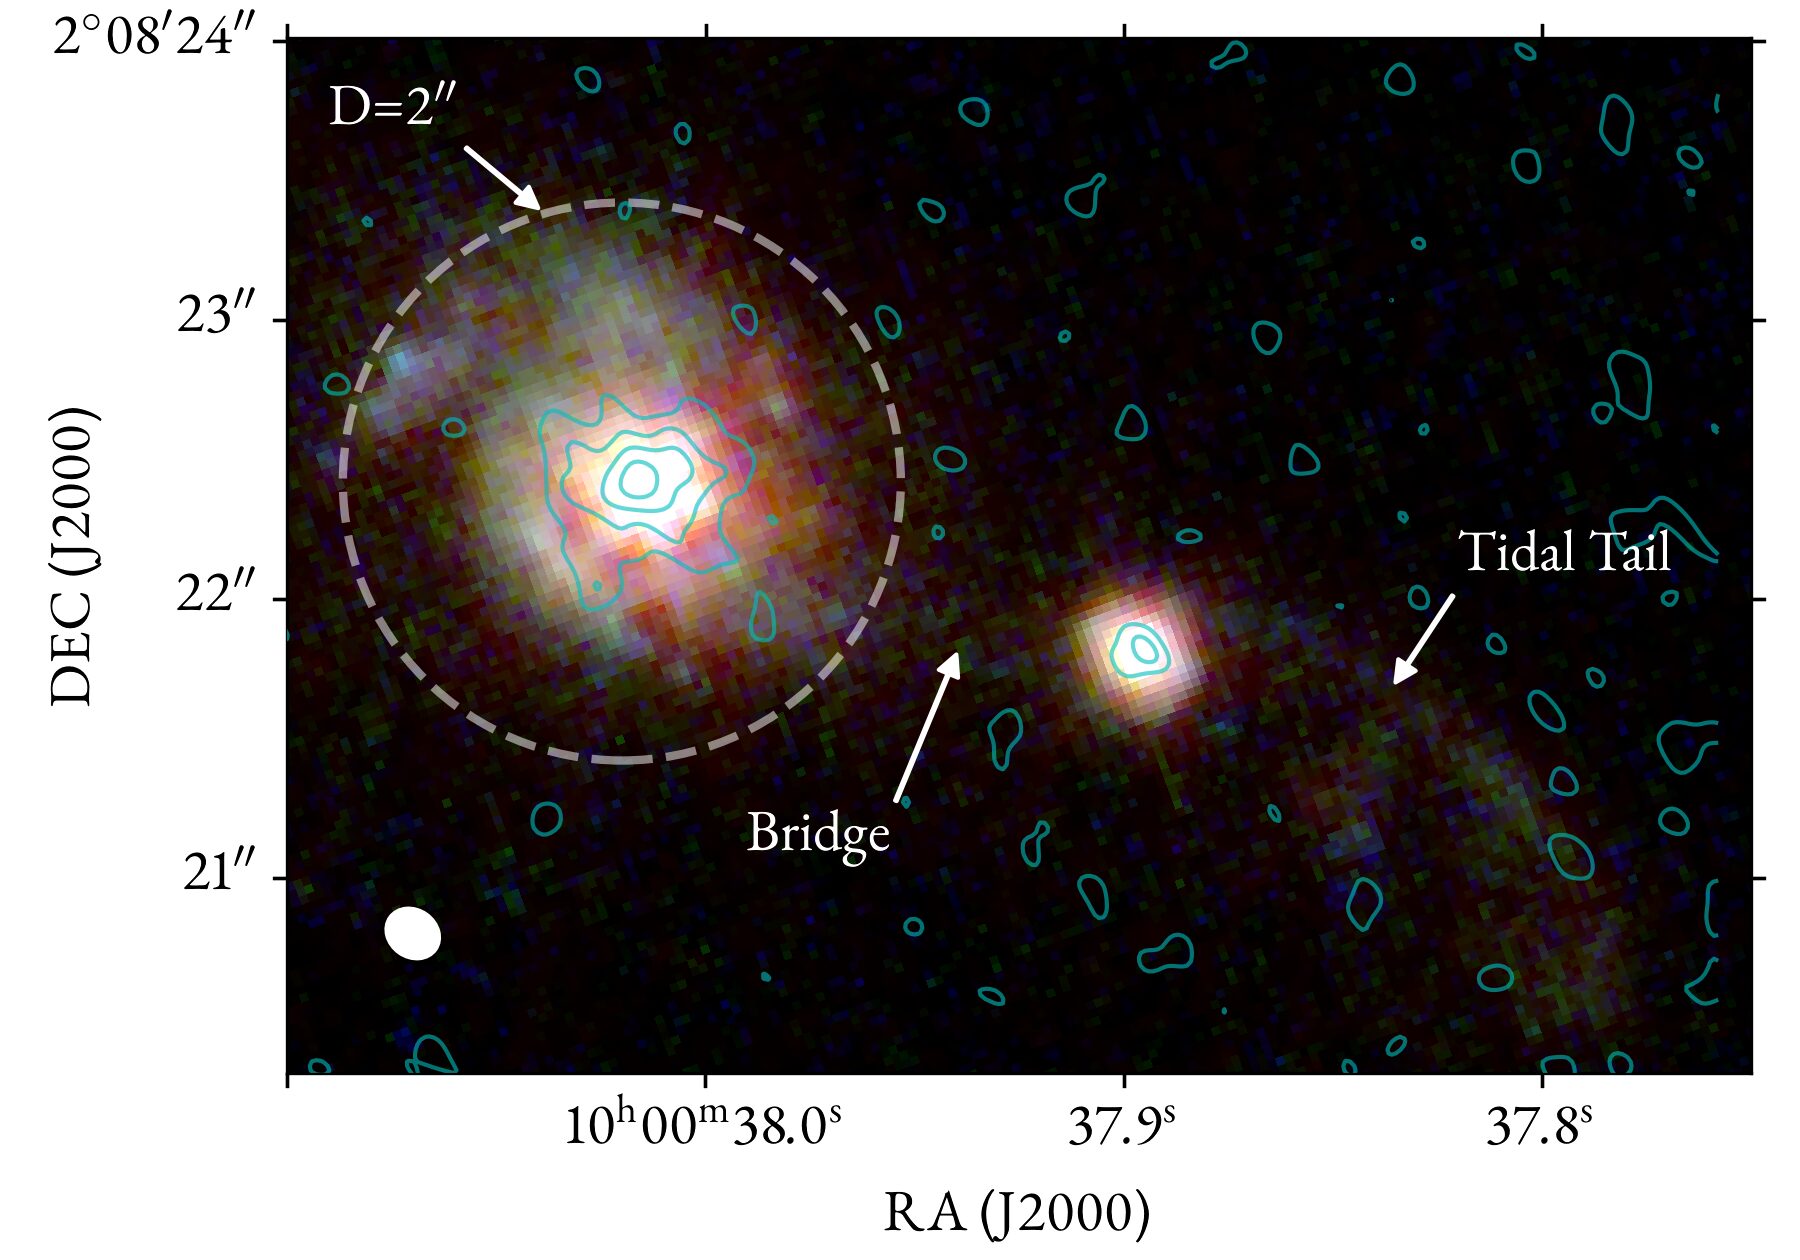
That team was the COSMOS team, and if you remember that J1000 was first discovered as a bright millimeter dot, that discovery was made by COSMOS! How serendipitous. So it’s only natural that when COSMOS pointed JWST at their favorite part of the sky they managed to capture J1000 as well! I cropped J1000 out of the COSMOS-WEB survey and got this stunning image:
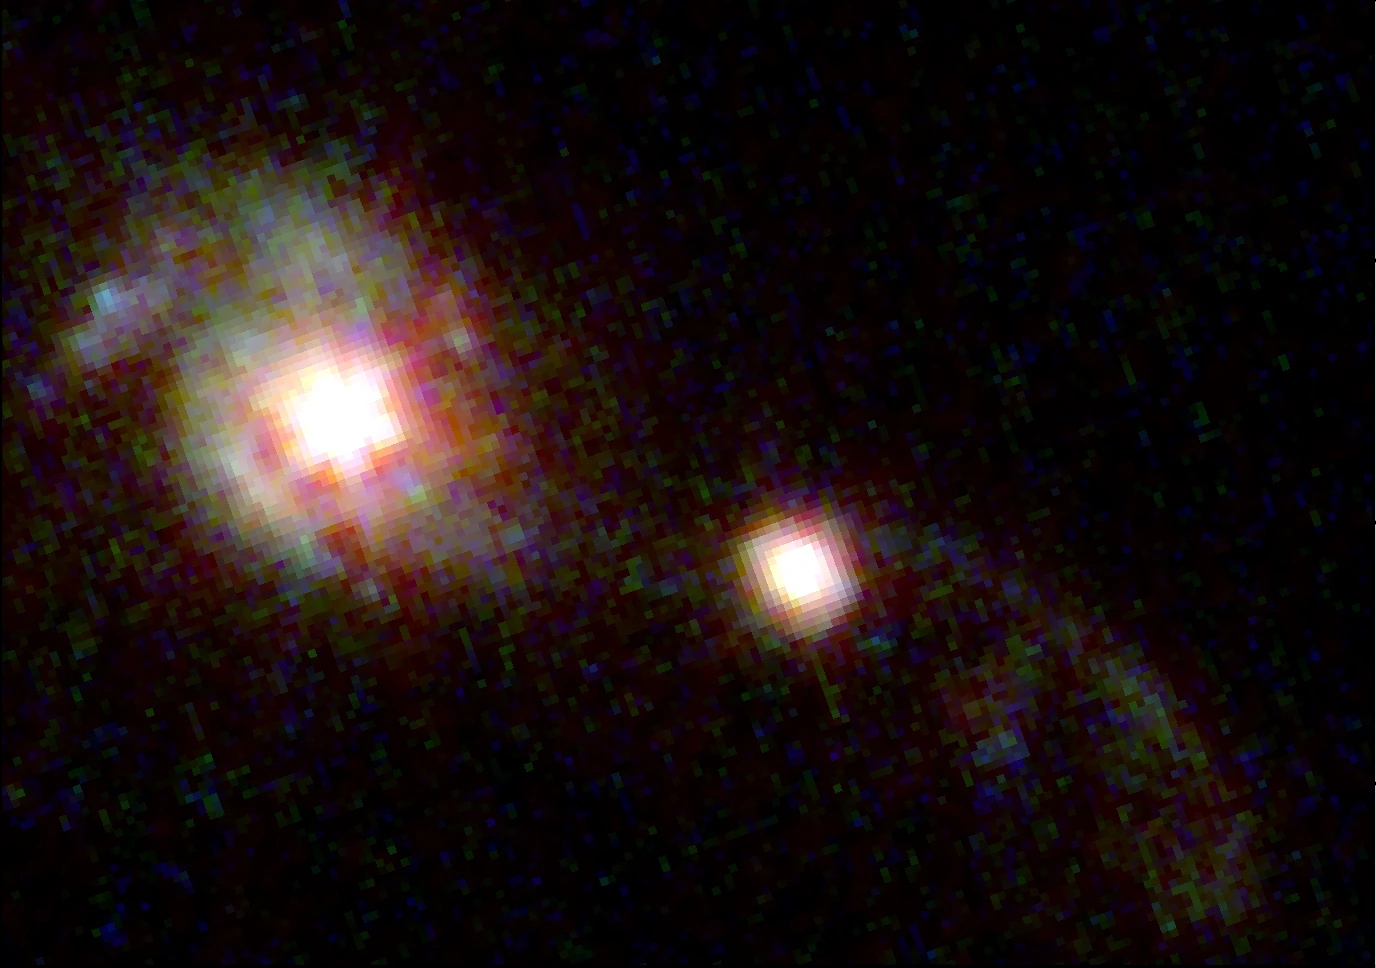
Woah. Not only do you see the main source and companion clearly as day, you might be able to convince yourself that there’s light in a kind of bridge between them, and a kind of tail waving off to the right past the satellite. I’d also claim that you can see spiral arms in the main galaxy, J1000.
And just to make sure everything lines up, I overlaid cyan lines representing [CII] brightnesses from ALMA onto the JWST image, and yep, these are the same objects!
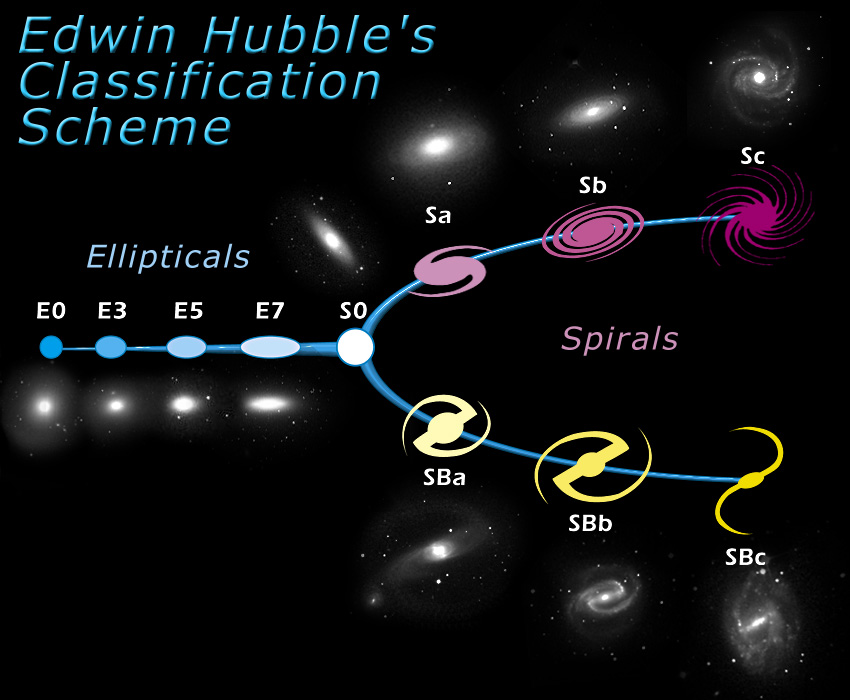
Even before we got the JWST image, we were starting to build up the argument that J1000 has a disk shape, rotating around its center. This is in contrast to elliptical galaxies, in the left half of the classification diagram on the right3, in which stars have uniformly random orbits through the galaxy, and irregular galaxies (not shown in the classification diagram on the right) which just look messy. That put J1000 into the right half of the image as “spiral-ish maybe”, but with JWST imaging we can say more definitely that it’s a spiral (maybe an Sa? I’m not that into galaxy taxonomy).
The ALMA image is actually even more detailed than what I showed earlier, and allows us to make a map of the velocity of the gas at any point in the image! Technically, that velocity map is the strongest evidence that J1000 is an ordered disk as opposed to a messy irregular or elliptical galaxy.
Galaxies about to collide?
I think the last important note is that we think J1000 and its satellite will spiral in and collide at some point after we observe it. (The estimate we make in the paper is that will take around 400 million years). The faint trail that connects the two in the JWST image is evidence that they may have already had a near miss in which the satellite got close enough to pull some gas and stars from the main source fling them outward. Perhaps surprisingly, estimates for the mass of the satellite source are comparable to the mass of the main one. This is probably simply because the newly formed/energetic/bright stars in the main source can greatly outshine an equal mass of older, dimmer stars in the satellite where all the bright ones with short lifetimes have died off.
Both galaxies are pretty massive, though, so when they merge they’ll produce a (probably elliptical) galaxy comparable to some of the most massive galaxies we have observed!
I hope you enjoyed this somewhat deep dive into my research. I think it’s pretty cool that we have the technology to see galaxies as they were 10 billion years ago, with massively intense star formation and UV fields, and even in some cases spiral arms and friends! None of this would have been possible without American investment into projects like NASA’s Hubble and James Webb space telescopes, and the National Science Foundation’s support of ZEUS and ALMA4.
- Side note: ZEUS observed with the Caltech Submillimeter Observatory (CSO) in Hawaii on Maunakea. Caltech and others are currently working on floating CSO across the ocean and putting it in Chile near ALMA. It will be renamed the Leighton Chajnantor Telescope. ↩︎
- The easiest and actually probably most accurate way to understand what’s going on is to just accept that, in the words of my friend, chemistry tutor Angelica Ionic, “the electrons do funky stuff and light comes out”. Otherwise you really do have to start solving Hamiltonians for spin and angular momentum coupling and adding relativistic corrections. Due to the coupling between the electron’s spin and orbital angular momentum, the spin and orbital momentum are constantly precessing around each other, changing direction, and neither starts nor ends in a simply explained state. That prevents me from saying something simple like “the electron’s spin flips, emitting a photon”. It might be accurate to say “the electron’s spin and orbital angular momentum reorient to be opposite each other”, but don’t quote me on that. ↩︎
- Image credit: NASA/Hubble. Science Release Credit: PRC99-34a: Credits for the ground-based image: Allan Sandage (The Observatories of the Carnegie Institution of Washington) and John Bedke (Computer Sciences Corporation and the Space Telescope Science Institute) Credits for the WFPC2 image: NASA and John Trauger (Jet Propulsion Laboratory) Credits for the NICMOS image: NASA, ESA, and C. Marcella Carollo (Johns Hopkins University and Columbia University); PRC99-34b: Credits for the ground-based images: Allan Sandage (The Observatories of the Carnegie Institution of Washington) and John Bedke (Computer Sciences Corporation and the Space Telescope Science Institute) Credits for WFPC2 and NICMOS composites: NASA, ESA, and Reynier Peletier (University of Nottingham, United Kingdom) ↩︎
- It may be interesting to note that the USA contributed approx. $0.6 billion, or $600 million, toward the development of ALMA, which cost about $1.5 billion ($1500 million) in total and is a collaboration between tens of countries including the USA, Canada, Japan, Taiwan, South Korea, and EU member states. JWST was about 7x as expensive as ALMA at $10 billion and was led primarily by NASA and the USA, with important contributions by Canada and Europe. The ZEUS project was funded by the NSF and operates on an annual budget around 1/1000th the cost of ALMA (approx. $1 million). There are hundreds of individual people who could single-handedly fund the development of a new ALMA, and tens who could single-handedly fund a new JWST. ↩︎
Leave a Reply