
I have recently been using Matplotlib to create graphics for a paper I am writing. One thing that has been bugging me, though, was a quirk in imshow which caused aliasing in the PDF exports of my images. I had assumed this wouldn’t be an issue based on the fact that PDF is a vector format and should easily be able to handle low-resolution images, and that the PDF, SVG, and AGG backends are specifically called out in the documentation for imshow‘s interpolation parameter.
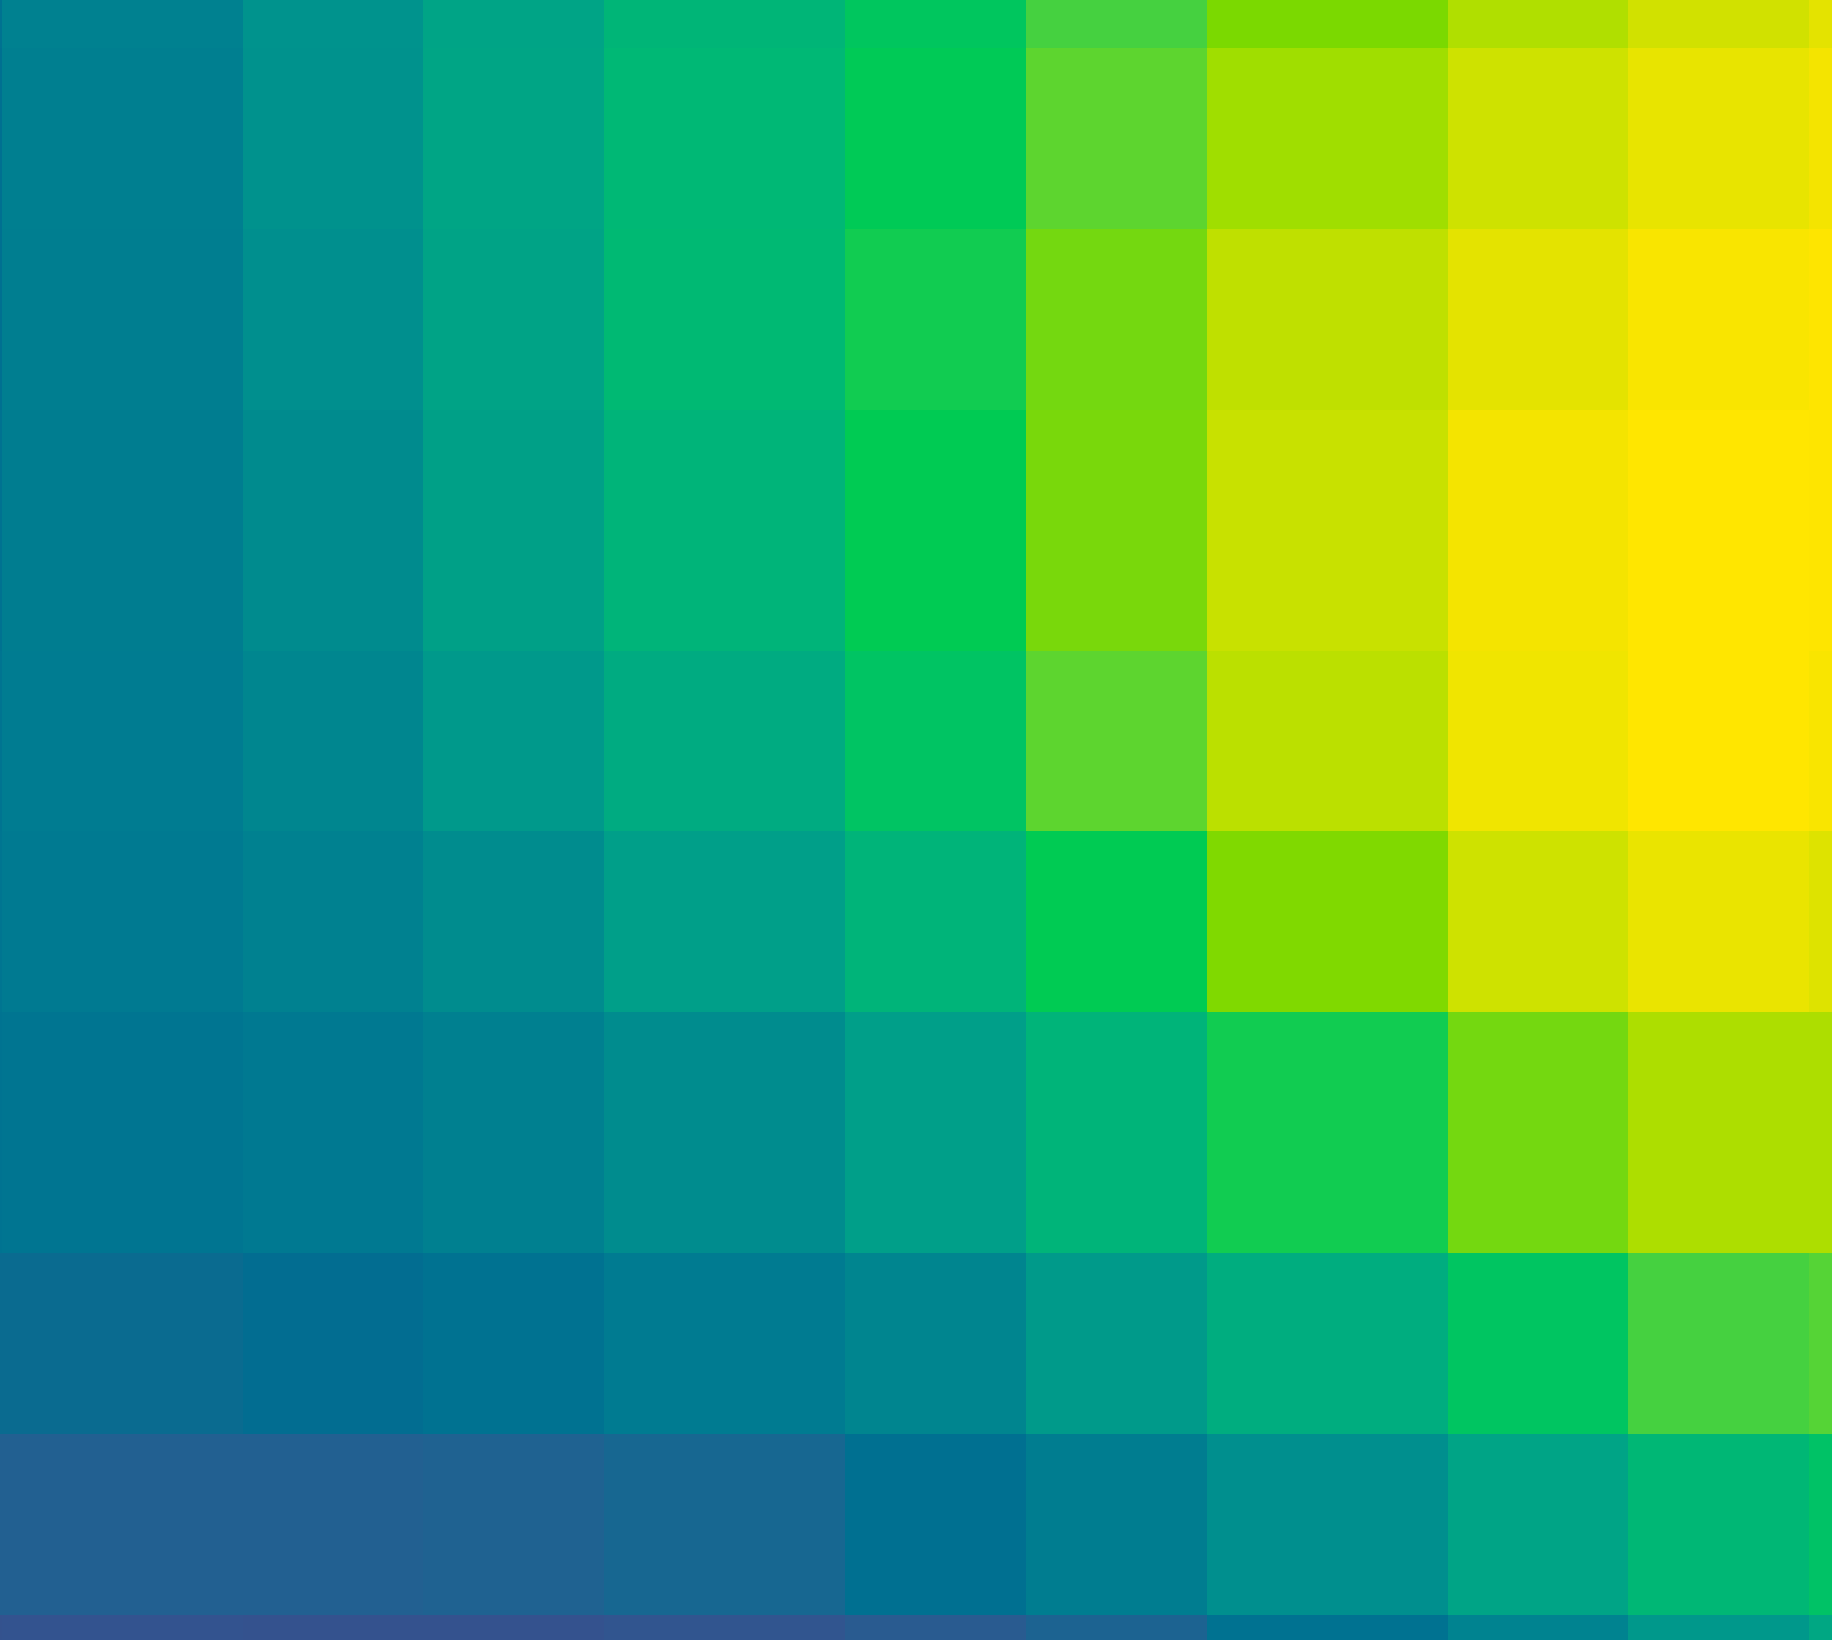
Instead, as seen here, many of the pixels were not quite square. Some were rectangular, causing artifacts when trying to view the whole image at once, including perceived lines traveling up and down the image. This shouldn’t happen!
Searching online was yielding no results. One of the two Stack Exchange posts I found was a different problem where border pixels were being cut off. The other appeared to be the same problem I was experiencing, but the answers only catered toward exporting bitmaps. (I ended up adding an answer there too.)
The solution was to use interpolation='none' in the call to imshow. For the vector backends this results in flawless images, at least in the case of oversampling, where the image pixels are much larger than the display pixels.

Leave a Reply